
-
- Height:
- 5-9
-
- Year:
- SO
-
- Hometown:
- Pendleton, IN
-
- High School:
- Pendleton Heights / Mount St. Joseph University
-
- Position:
- F
-
- Major:
- Biology Health Sciences
-
- gp
- 19
-
- pts/g
- 12.5
-
- fg %
- 42.2
-
- 3pt %
- 28.6
-
- ft %
- 56.5
-
- reb/g
- 4.2
-
- a/g
- 0.7
Bio
2023-2024 at Mount St. Joseph University:
- Played in 23 games, making one start and averaging 13.4 minutes per contest
- Averaged a bench-high 8.4 points per game on 46.1 percent accuracy from the floor.
- Added 4.2 rebounds, 1.5 steals, 0.7 blocks and 0.5 assists per contest.
- Named to the HCAC All First-Year Team.
Prep: Earned nine total varsity letters – four in basketball and five combined in volleyball and track … Played for coach Nick Rogers in high school … Also played club ball for Indiana Girls Basketball under Chad Novinger … Was a 1,000-point scorer at Pendleton Heights ... Made HHC All-Conference and all-county teams … Recognized as academic all-state and academic all-conference … Made the academic honor roll … Member of the National Honor Society.
Personal: Daughter of Nathan and Tiffany Warfel ... Majoring in biology health sciences.
Recent games
Season Statistics
| Overall | Conference | |
|---|---|---|
| Games | 19 | 9 |
| Games started | 11 | 7 |
| Minutes | 378 | 199 |
| Minutes per game | 19.9 | 22.1 |
| FG | 95-225 | 51-118 |
| FG Pct | 42.2 | 43.2 |
| 3PT | 22-77 | 14-46 |
| 3PT Pct | 28.6 | 30.4 |
| FT | 26-46 | 9-18 |
| FT Pct | 56.5 | 50.0 |
| Off rebounds | 26 | 6 |
| Def rebounds | 53 | 26 |
| Total rebounds | 79 | 32 |
| Rebounds per game | 4.2 | 3.6 |
| Personal fouls | 56 | 29 |
| Disqualifications | 3 | 1 |
| Assists | 13 | 6 |
| Turnovers | 39 | 22 |
| Assist to turnover ratio | 0.3 | 0.3 |
| Steals | 28 | 16 |
| Blocks | 11 | 9 |
| Points | 238 | 125 |
| Points per game | 12.5 | 13.9 |
| Points per 40 min | 25.2 | 25.1 |
Game Log - Shooting
| Date | Opponent | Score | gs | min | fg | pct | 3pt | pct | ft | pct | pts |
|---|---|---|---|---|---|---|---|---|---|---|---|
| Oct 25 | Holy Cross | W, 80-72 | - | 19 | 5-10 | 50.0 | 2-6 | 33.3 | 5-6 | 83.3 | 17 |
| Oct 29 | Indiana University Columbus | W, 97-59 | - | 18 | 3-10 | 30.0 | 0-1 | 0.0 | 1-2 | 50.0 | 7 |
| Nov 1 | at Butler | L, 99-48 | - | - | - | - | - | - | - | - | - |
| Nov 2 | Trinity Christian | W, 87-56 | - | 13 | 2-8 | 25.0 | 0-2 | 0.0 | 0-0 | - | 4 |
| Nov 9 | at Olivet Nazarene | L, 92-76 | - | 8 | 0-3 | 0.0 | 0-1 | 0.0 | 0-0 | - | 0 |
| Nov 12 | at Michigan-Dearborn | W, 100-62 | 0 | 21 | 11-15 | 73.3 | 1-1 | 100.0 | 1-2 | 50.0 | 24 |
| Nov 16 | at #RV IU South Bend | L, 75-68 | - | 24 | 7-11 | 63.6 | 2-4 | 50.0 | 2-4 | 50.0 | 18 |
| Nov 20 | at #18 Saint Francis | L, 88-57 | - | 17 | 2-9 | 22.2 | 1-4 | 25.0 | 0-0 | - | 5 |
| Nov 23 | Mount Vernon Nazarene | L, 98-75 | - | 17 | 7-12 | 58.3 | 2-6 | 33.3 | 0-0 | - | 16 |
| Dec 4 | at #16 Marian | L, 84-49 | 1 | 19 | 4-10 | 40.0 | 0-4 | 0.0 | 2-4 | 50.0 | 10 |
| Dec 7 | Grace | L, 81-76 | 1 | 31 | 9-22 | 40.9 | 2-7 | 28.6 | 4-6 | 66.7 | 24 |
| Dec 12 | at Indiana Southeast | L, 79-75 | 1 | 15 | 1-8 | 12.5 | 0-2 | 0.0 | 2-2 | 100.0 | 4 |
| Dec 17 | IU Kokomo | W, 66-56 | 1 | 21 | 4-14 | 28.6 | 1-5 | 20.0 | 2-2 | 100.0 | 11 |
| Dec 18 | Ohio Christian | L, 74-70 | 1 | 25 | 9-17 | 52.9 | 2-6 | 33.3 | 3-8 | 37.5 | 23 |
| Dec 30 | at #23 Indiana Tech | L, 66-50 | 1 | 15 | 2-11 | 18.2 | 0-3 | 0.0 | 1-2 | 50.0 | 5 |
| Jan 4 | at Spring Arbor | L, 73-54 | 1 | 25 | 6-15 | 40.0 | 1-6 | 16.7 | 1-2 | 50.0 | 14 |
| Jan 8 | #2 Indiana Wesleyan | L, 81-48 | 1 | 23 | 8-12 | 66.7 | 5-6 | 83.3 | 1-2 | 50.0 | 22 |
| Jan 11 | Goshen | L, 62-60 | 1 | 23 | 8-18 | 44.4 | 1-5 | 20.0 | 1-2 | 50.0 | 18 |
| Jan 15 | at Huntington | L, 72-62 | 1 | 24 | 1-10 | 10.0 | 0-4 | 0.0 | 0-0 | - | 2 |
| Jan 18 | Bethel | W, 75-59 | 1 | 20 | 6-10 | 60.0 | 2-4 | 50.0 | 0-2 | 0.0 | 14 |
| Jan 25 | #10 Saint Francis | - | - | - | - | - | - | - | - | - | |
| Jan 29 | at Mount Vernon Nazarene | - | - | - | - | - | - | - | - | - | |
| Feb 1 | #17 Marian | - | - | - | - | - | - | - | - | - | |
| Feb 5 | at Grace | - | - | - | - | - | - | - | - | - | |
| Feb 8 | Spring Arbor | - | - | - | - | - | - | - | - | - | |
| Feb 12 | at #2 Indiana Wesleyan | - | - | - | - | - | - | - | - | - | |
| Feb 15 | at Goshen | - | - | - | - | - | - | - | - | - | |
| Feb 19 | Huntington | - | - | - | - | - | - | - | - | - | |
| Feb 22 | at Bethel | - | - | - | - | - | - | - | - | - | |
| Feb 26 | TBA | - | - | - | - | - | - | - | - | - | |
| Mar 1 | TBA | - | - | - | - | - | - | - | - | - | |
| Mar 4 | TBA | - | - | - | - | - | - | - | - | - |
Game Log - Ball control
| Date | Opponent | Score | gs | min | off | def | reb | ast | to | stl | blk |
|---|---|---|---|---|---|---|---|---|---|---|---|
| Oct 25 | Holy Cross | W, 80-72 | - | 19 | 2 | 6 | 8 | 3 | 4 | 2 | 0 |
| Oct 29 | Indiana University Columbus | W, 97-59 | - | 18 | 4 | 1 | 5 | 1 | 4 | 2 | 0 |
| Nov 1 | at Butler | L, 99-48 | - | - | - | - | - | - | - | - | - |
| Nov 2 | Trinity Christian | W, 87-56 | - | 13 | 2 | 1 | 3 | 1 | 0 | 2 | 1 |
| Nov 9 | at Olivet Nazarene | L, 92-76 | - | 8 | 0 | 3 | 3 | 0 | 2 | 0 | 0 |
| Nov 12 | at Michigan-Dearborn | W, 100-62 | 0 | 21 | 5 | 4 | 9 | 0 | 1 | 2 | 0 |
| Nov 16 | at #RV IU South Bend | L, 75-68 | - | 24 | 1 | 4 | 5 | 1 | 1 | 1 | 0 |
| Nov 20 | at #18 Saint Francis | L, 88-57 | - | 17 | 1 | 6 | 7 | 0 | 2 | 3 | 2 |
| Nov 23 | Mount Vernon Nazarene | L, 98-75 | - | 17 | 0 | 1 | 1 | 0 | 1 | 2 | 0 |
| Dec 4 | at #16 Marian | L, 84-49 | 1 | 19 | 1 | 3 | 4 | 1 | 3 | 0 | 0 |
| Dec 7 | Grace | L, 81-76 | 1 | 31 | 4 | 2 | 6 | 2 | 2 | 3 | 2 |
| Dec 12 | at Indiana Southeast | L, 79-75 | 1 | 15 | 0 | 1 | 1 | 0 | 1 | 1 | 0 |
| Dec 17 | IU Kokomo | W, 66-56 | 1 | 21 | 2 | 0 | 2 | 1 | 2 | 1 | 0 |
| Dec 18 | Ohio Christian | L, 74-70 | 1 | 25 | 2 | 5 | 7 | 0 | 2 | 1 | 1 |
| Dec 30 | at #23 Indiana Tech | L, 66-50 | 1 | 15 | 2 | 2 | 4 | 0 | 0 | 0 | 0 |
| Jan 4 | at Spring Arbor | L, 73-54 | 1 | 25 | 0 | 2 | 2 | 0 | 4 | 2 | 2 |
| Jan 8 | #2 Indiana Wesleyan | L, 81-48 | 1 | 23 | 0 | 3 | 3 | 1 | 2 | 3 | 1 |
| Jan 11 | Goshen | L, 62-60 | 1 | 23 | 0 | 4 | 4 | 0 | 5 | 1 | 0 |
| Jan 15 | at Huntington | L, 72-62 | 1 | 24 | 0 | 4 | 4 | 2 | 1 | 1 | 1 |
| Jan 18 | Bethel | W, 75-59 | 1 | 20 | 0 | 1 | 1 | 0 | 2 | 1 | 1 |
| Jan 25 | #10 Saint Francis | - | - | - | - | - | - | - | - | - | |
| Jan 29 | at Mount Vernon Nazarene | - | - | - | - | - | - | - | - | - | |
| Feb 1 | #17 Marian | - | - | - | - | - | - | - | - | - | |
| Feb 5 | at Grace | - | - | - | - | - | - | - | - | - | |
| Feb 8 | Spring Arbor | - | - | - | - | - | - | - | - | - | |
| Feb 12 | at #2 Indiana Wesleyan | - | - | - | - | - | - | - | - | - | |
| Feb 15 | at Goshen | - | - | - | - | - | - | - | - | - | |
| Feb 19 | Huntington | - | - | - | - | - | - | - | - | - | |
| Feb 22 | at Bethel | - | - | - | - | - | - | - | - | - | |
| Feb 26 | TBA | - | - | - | - | - | - | - | - | - | |
| Mar 1 | TBA | - | - | - | - | - | - | - | - | - | |
| Mar 4 | TBA | - | - | - | - | - | - | - | - | - |
Game Log - Ball control extended
| Date | Opponent | Score | gs | pf | dq | a/to |
|---|---|---|---|---|---|---|
| Oct 25 | Holy Cross | W, 80-72 | - | 2 | - | 0.8 |
| Oct 29 | Indiana University Columbus | W, 97-59 | - | 3 | - | 0.3 |
| Nov 1 | at Butler | L, 99-48 | - | - | - | - |
| Nov 2 | Trinity Christian | W, 87-56 | - | 3 | - | - |
| Nov 9 | at Olivet Nazarene | L, 92-76 | - | 0 | - | 0.0 |
| Nov 12 | at Michigan-Dearborn | W, 100-62 | 0 | 2 | 0 | 0.0 |
| Nov 16 | at #RV IU South Bend | L, 75-68 | - | 2 | - | 1.0 |
| Nov 20 | at #18 Saint Francis | L, 88-57 | - | 1 | - | 0.0 |
| Nov 23 | Mount Vernon Nazarene | L, 98-75 | - | 3 | - | 0.0 |
| Dec 4 | at #16 Marian | L, 84-49 | 1 | 4 | - | 0.3 |
| Dec 7 | Grace | L, 81-76 | 1 | 4 | - | 1.0 |
| Dec 12 | at Indiana Southeast | L, 79-75 | 1 | 2 | - | 0.0 |
| Dec 17 | IU Kokomo | W, 66-56 | 1 | 5 | 1 | 0.5 |
| Dec 18 | Ohio Christian | L, 74-70 | 1 | 3 | - | 0.0 |
| Dec 30 | at #23 Indiana Tech | L, 66-50 | 1 | 5 | 1 | - |
| Jan 4 | at Spring Arbor | L, 73-54 | 1 | 2 | - | 0.0 |
| Jan 8 | #2 Indiana Wesleyan | L, 81-48 | 1 | 3 | - | 0.5 |
| Jan 11 | Goshen | L, 62-60 | 1 | 3 | - | 0.0 |
| Jan 15 | at Huntington | L, 72-62 | 1 | 5 | 1 | 2.0 |
| Jan 18 | Bethel | W, 75-59 | 1 | 4 | - | 0.0 |
| Jan 25 | #10 Saint Francis | - | - | - | - | |
| Jan 29 | at Mount Vernon Nazarene | - | - | - | - | |
| Feb 1 | #17 Marian | - | - | - | - | |
| Feb 5 | at Grace | - | - | - | - | |
| Feb 8 | Spring Arbor | - | - | - | - | |
| Feb 12 | at #2 Indiana Wesleyan | - | - | - | - | |
| Feb 15 | at Goshen | - | - | - | - | |
| Feb 19 | Huntington | - | - | - | - | |
| Feb 22 | at Bethel | - | - | - | - | |
| Feb 26 | TBA | - | - | - | - | |
| Mar 1 | TBA | - | - | - | - | |
| Mar 4 | TBA | - | - | - | - |
| gp | min/g | fg/g | 3pt/g | ft/g | ppg | |
|---|---|---|---|---|---|---|
| 2024-25 | 19 | 19.9 | 5.0-11.8 | 1.2-4.1 | 1.4-2.4 | 12.5 |
| Total | 19 | 19.9 | 5.0-11.8 | 1.2-4.1 | 1.4-2.4 | 12.5 |
Career Stats: Shooting per game
| gp | gs | min | fg | pct | 3pt | pct | ft | pct | pts | |
|---|---|---|---|---|---|---|---|---|---|---|
| 2024-25 | 19 | 11 | 378 | 95-225 | 42.2 | 22-77 | 28.6 | 26-46 | 56.5 | 238 |
| Total | 19 | 11 | 378 | 95-225 | 42.2 | 22-77 | 28.6 | 26-46 | 56.5 | 238 |
Career Stats: Shooting totals
| gp | min | min/g | fg/40 | 3pt/40 | pct | ft/40 | pts/40 | |
|---|---|---|---|---|---|---|---|---|
| 2024-25 | 19 | 378 | 19.9 | 10.1-23.8 | 2.3-8.1 | 28.6 | 2.8-4.9 | 25.2 |
| Total | 19 | 378 | 19.9 | 10.1-23.8 | 2.3-8.1 | 28.6 | 2.8-4.9 | 25.2 |
Career Stats: Shooting per 40 min
| gp | off/g | def/g | reb/g | ast/g | to/g | stl/g | blk/g | |
|---|---|---|---|---|---|---|---|---|
| 2024-25 | 19 | 1.4 | 2.8 | 4.2 | 0.7 | 2.1 | 1.5 | 0.6 |
| Total | 19 | 1.4 | 2.8 | 4.2 | 0.7 | 2.1 | 1.5 | 0.6 |
Career Stats: Ball control per game
| gp | gs | off | def | reb | ast | to | stl | blk | |
|---|---|---|---|---|---|---|---|---|---|
| 2024-25 | 19 | 11 | 26 | 53 | 79 | 13 | 39 | 28 | 11 |
| Total | 19 | 11 | 26 | 53 | 79 | 13 | 39 | 28 | 11 |
Career Stats: Ball control totals
| gp | off/40 | def/40 | reb/40 | ast/40 | to/40 | stl/40 | blk/40 | |
|---|---|---|---|---|---|---|---|---|
| 2024-25 | 19 | 2.8 | 5.6 | 8.4 | 1.4 | 4.1 | 3.0 | 1.2 |
| Total | 19 | 2.8 | 5.6 | 8.4 | 1.4 | 4.1 | 3.0 | 1.2 |
Career Stats: Ball control per 40 min
| gp | min/g | fg/g | 3pt/g | ft/g | ppg | |
|---|---|---|---|---|---|---|
| Event | ||||||
| Total | 19 | 19.9 | 5.0-11.8 | 1.2-4.1 | 1.4-2.4 | 12.5 |
| Conference | 9 | 22.1 | 5.7-13.1 | 1.6-5.1 | 1.0-2.0 | 13.9 |
| Exhibition | - | - | 0.0-0.0 | 0.0-0.0 | 0.0-0.0 | - |
| Location | ||||||
| Home | 10 | 21.0 | 6.1-13.3 | 1.7-4.8 | 1.7-3.0 | 15.6 |
| Away | 9 | 18.7 | 3.8-10.2 | 0.6-3.2 | 1.0-1.8 | 9.1 |
| Neutral | - | - | 0.0-0.0 | 0.0-0.0 | 0.0-0.0 | - |
| Result | ||||||
| Wins | 6 | 18.7 | 5.2-11.2 | 1.0-3.2 | 1.5-2.3 | 12.8 |
| Losses | 13 | 20.5 | 4.9-12.2 | 1.2-4.5 | 1.3-2.5 | 12.4 |
| Month | ||||||
| October | 2 | 18.5 | 4.0-10.0 | 1.0-3.5 | 3.0-4.0 | 12.0 |
| November | 6 | 16.7 | 4.8-9.7 | 1.0-3.0 | 0.5-1.0 | 11.2 |
| December | 6 | 21.0 | 4.8-13.7 | 0.8-4.5 | 2.3-4.0 | 12.8 |
| January | 5 | 23.0 | 5.8-13.0 | 1.8-5.0 | 0.6-1.6 | 14.0 |
Splits Stats: Shooting per game
| gp | gs | min | fg | pct | 3pt | pct | ft | pct | pts | |
|---|---|---|---|---|---|---|---|---|---|---|
| Event | ||||||||||
| Total | 19 | 11 | 378 | 95-225 | 42.2 | 22-77 | 28.6 | 26-46 | 56.5 | 238 |
| Conference | 9 | 7 | 199 | 51-118 | 43.2 | 14-46 | 30.4 | 9-18 | 50.0 | 125 |
| Exhibition | - | - | - | 0-0 | - | 0-0 | - | 0-0 | - | 0 |
| Location | ||||||||||
| Home | 10 | 6 | 210 | 61-133 | 45.9 | 17-48 | 35.4 | 17-30 | 56.7 | 156 |
| Away | 9 | 5 | 168 | 34-92 | 37.0 | 5-29 | 17.2 | 9-16 | 56.3 | 82 |
| Neutral | - | - | - | 0-0 | - | 0-0 | - | 0-0 | - | 0 |
| Result | ||||||||||
| Wins | 6 | 2 | 112 | 31-67 | 46.3 | 6-19 | 31.6 | 9-14 | 64.3 | 77 |
| Losses | 13 | 9 | 266 | 64-158 | 40.5 | 16-58 | 27.6 | 17-32 | 53.1 | 161 |
| Month | ||||||||||
| October | 2 | - | 37 | 8-20 | 40.0 | 2-7 | 28.6 | 6-8 | 75.0 | 24 |
| November | 6 | 0 | 100 | 29-58 | 50.0 | 6-18 | 33.3 | 3-6 | 50.0 | 67 |
| December | 6 | 6 | 126 | 29-82 | 35.4 | 5-27 | 18.5 | 14-24 | 58.3 | 77 |
| January | 5 | 5 | 115 | 29-65 | 44.6 | 9-25 | 36.0 | 3-8 | 37.5 | 70 |
Splits Stats: Shooting totals
| gp | min | min/g | fg/40 | 3pt/40 | pct | ft/40 | pts/40 | |
|---|---|---|---|---|---|---|---|---|
| Event | ||||||||
| Total | 19 | 378 | 19.9 | 10.1-23.8 | 2.3-8.1 | 28.6 | 2.8-4.9 | 25.2 |
| Conference | 9 | 199 | 22.1 | 10.3-23.7 | 2.8-9.2 | 30.4 | 1.8-3.6 | 25.1 |
| Exhibition | - | - | - | 0.0-0.0 | 0.0-0.0 | - | 0.0-0.0 | - |
| Location | ||||||||
| Home | 10 | 210 | 21.0 | 11.6-25.3 | 3.2-9.1 | 35.4 | 3.2-5.7 | 29.7 |
| Away | 9 | 168 | 18.7 | 8.1-21.9 | 1.2-6.9 | 17.2 | 2.1-3.8 | 19.5 |
| Neutral | - | - | - | 0.0-0.0 | 0.0-0.0 | - | 0.0-0.0 | - |
| Result | ||||||||
| Wins | 6 | 112 | 18.7 | 11.1-23.9 | 2.1-6.8 | 31.6 | 3.2-5.0 | 27.5 |
| Losses | 13 | 266 | 20.5 | 9.6-23.8 | 2.4-8.7 | 27.6 | 2.6-4.8 | 24.2 |
| Month | ||||||||
| October | 2 | 37 | 18.5 | 8.6-21.6 | 2.2-7.6 | 28.6 | 6.5-8.6 | 25.9 |
| November | 6 | 100 | 16.7 | 11.6-23.2 | 2.4-7.2 | 33.3 | 1.2-2.4 | 26.8 |
| December | 6 | 126 | 21.0 | 9.2-26.0 | 1.6-8.6 | 18.5 | 4.4-7.6 | 24.4 |
| January | 5 | 115 | 23.0 | 10.1-22.6 | 3.1-8.7 | 36.0 | 1.0-2.8 | 24.3 |
Splits Stats: Shooting per 40 min
| gp | off/g | def/g | reb/g | ast/g | to/g | stl/g | blk/g | |
|---|---|---|---|---|---|---|---|---|
| Event | ||||||||
| Total | 19 | 1.4 | 2.8 | 4.2 | 0.7 | 2.1 | 1.5 | 0.6 |
| Conference | 9 | 0.7 | 2.9 | 3.6 | 0.7 | 2.4 | 1.8 | 1.0 |
| Exhibition | - | - | - | - | - | - | - | - |
| Location | ||||||||
| Home | 10 | 1.6 | 2.4 | 4.0 | 0.9 | 2.4 | 1.8 | 0.6 |
| Away | 9 | 1.1 | 3.2 | 4.3 | 0.4 | 1.7 | 1.1 | 0.6 |
| Neutral | - | - | - | - | - | - | - | - |
| Result | ||||||||
| Wins | 6 | 2.5 | 2.2 | 4.7 | 1.0 | 2.2 | 1.7 | 0.3 |
| Losses | 13 | 0.8 | 3.1 | 3.9 | 0.5 | 2.0 | 1.4 | 0.7 |
| Month | ||||||||
| October | 2 | 3.0 | 3.5 | 6.5 | 2.0 | 4.0 | 2.0 | 0.0 |
| November | 6 | 1.5 | 3.2 | 4.7 | 0.3 | 1.2 | 1.7 | 0.5 |
| December | 6 | 1.8 | 2.2 | 4.0 | 0.7 | 1.7 | 1.0 | 0.5 |
| January | 5 | 0.0 | 2.8 | 2.8 | 0.6 | 2.8 | 1.6 | 1.0 |
Splits Stats: Ball control per game
| gp | gs | off | def | reb | ast | to | stl | blk | |
|---|---|---|---|---|---|---|---|---|---|
| Event | |||||||||
| Total | 19 | 11 | 26 | 53 | 79 | 13 | 39 | 28 | 11 |
| Conference | 9 | 7 | 6 | 26 | 32 | 6 | 22 | 16 | 9 |
| Exhibition | - | - | - | - | - | - | - | - | - |
| Location | |||||||||
| Home | 10 | 6 | 16 | 24 | 40 | 9 | 24 | 18 | 6 |
| Away | 9 | 5 | 10 | 29 | 39 | 4 | 15 | 10 | 5 |
| Neutral | - | - | - | - | - | - | - | - | - |
| Result | |||||||||
| Wins | 6 | 2 | 15 | 13 | 28 | 6 | 13 | 10 | 2 |
| Losses | 13 | 9 | 11 | 40 | 51 | 7 | 26 | 18 | 9 |
| Month | |||||||||
| October | 2 | - | 6 | 7 | 13 | 4 | 8 | 4 | 0 |
| November | 6 | 0 | 9 | 19 | 28 | 2 | 7 | 10 | 3 |
| December | 6 | 6 | 11 | 13 | 24 | 4 | 10 | 6 | 3 |
| January | 5 | 5 | 0 | 14 | 14 | 3 | 14 | 8 | 5 |
Splits Stats: Ball control totals
| gp | off/40 | def/40 | reb/40 | ast/40 | to/40 | stl/40 | blk/40 | |
|---|---|---|---|---|---|---|---|---|
| Event | ||||||||
| Total | 19 | 2.8 | 5.6 | 8.4 | 1.4 | 4.1 | 3.0 | 1.2 |
| Conference | 9 | 1.2 | 5.2 | 6.4 | 1.2 | 4.4 | 3.2 | 1.8 |
| Exhibition | - | - | - | - | - | - | - | - |
| Location | ||||||||
| Home | 10 | 3.0 | 4.6 | 7.6 | 1.7 | 4.6 | 3.4 | 1.1 |
| Away | 9 | 2.4 | 6.9 | 9.3 | 1.0 | 3.6 | 2.4 | 1.2 |
| Neutral | - | - | - | - | - | - | - | - |
| Result | ||||||||
| Wins | 6 | 5.4 | 4.6 | 10.0 | 2.1 | 4.6 | 3.6 | 0.7 |
| Losses | 13 | 1.7 | 6.0 | 7.7 | 1.1 | 3.9 | 2.7 | 1.4 |
| Month | ||||||||
| October | 2 | 6.5 | 7.6 | 14.1 | 4.3 | 8.6 | 4.3 | 0.0 |
| November | 6 | 3.6 | 7.6 | 11.2 | 0.8 | 2.8 | 4.0 | 1.2 |
| December | 6 | 3.5 | 4.1 | 7.6 | 1.3 | 3.2 | 1.9 | 1.0 |
| January | 5 | 0.0 | 4.9 | 4.9 | 1.0 | 4.9 | 2.8 | 1.7 |
Splits Stats: Ball control per 40 min
News mentions

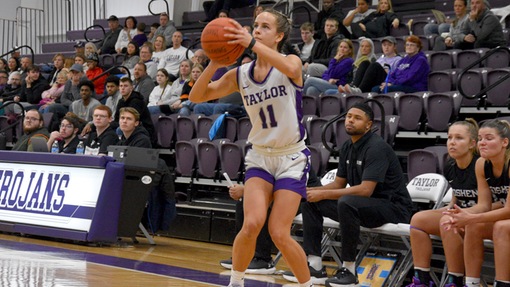
Four Starters Score in Double Figures in Victory Over Pilots
January 18, 2025
Tough Fourth Quarter at HU Prolongs Skid
January 15, 2025

First-Half Lead Slips in Heartbreaking Home Loss
January 11, 2025
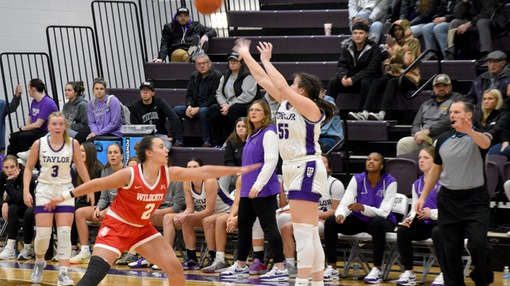
Warfel Efficient in Loss to No. 2 IWU
January 8, 2025
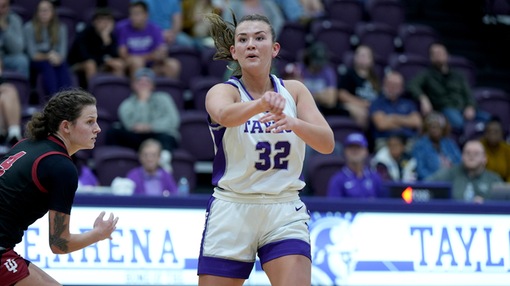
TU Women’s Hoops Falls to SAU
January 4, 2025

Taylor Drops Trojan Classic Finale to OCU
December 18, 2024

TU Defense Comes Through to Snap Skid, Pick Up 900th All-Time Win
December 17, 2024

Turnovers Prove Costly in Back-and-Forth Battle with Grace
December 7, 2024
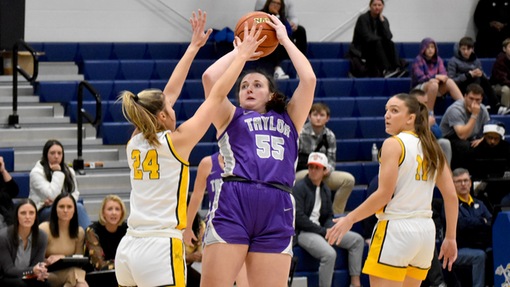
Women’s Basketball Falls to No. 16 Marian on Road
December 4, 2024

Trojans Overpowered by Cougars in Home Defeat
November 23, 2024
TU Outpaced by No. 18 USF to Start League Play
November 20, 2024

Trojans Go Toe-to-Toe with #RV Titans in Tight Loss
November 16, 2024

Warfel, Henson Headline Huge Night for TU Offense
November 12, 2024

Trojans Stave Off Trolls to Remain Perfect on Season
November 2, 2024

Taylor Plays at Butler in Exhibition
November 1, 2024

Henson Reaches 1,000-Career Points in Wire-to-Wire Win
October 29, 2024
Ott Scores Career-High 19 in Season-Opening Victory
October 25, 2024


